(Continuing
an occasional series on the history of political regimes. Lots of charts and graphs, and one slideshow, using the
Political Institutions and Political Events dataset by Adam Przeworski et al., which is a fantastic resource for people interested in this topic. And I like pictures!).
People sometimes do not realize how total has been the
normative triumph of some of the ideas typically associated with democracy, even if one thinks that democracy itself has not succeeded quite as spectacularly. Take, for instance, the norm that rulers of states should be selected through some process that involves
voting by all adults in society (I'm being deliberately vague here) rather than, say, inheriting their position by succeeding their fathers. In 1788 there were only a couple of countries in the world that could even claim to publicly recognize something remotely like this norm. Most people could not vote, and voting was not generally recognized as something that needed to happen before rulers could rule; rulers could and did claim to have authority to rule on other grounds.
Norms of hereditary selection structured the symbolic universe in which political competition took place, and defined its ultimate boundaries for most people (at least those who lived in
state spaces). Yet by 2008 there were only four or five countries in the world that did
not publicly acknowledge universal voting rights:
(You can watch the slideshow in full screen or view the individual maps separately
here.)
Each map in the slideshow displays three pieces of information, all taken from the
PIPE dataset (see the data and methods note at the bottom of this post for more information about the dataset and the process used to generate the maps, including some R code): the type of class and gender franchise restrictions in place in a particular country for a particular year (the number inside each bubble, and the color of each bubble); whether other franchise restrictions are recorded (such as restrictions on voting by priests or the military; this is the border color of each bubble); and whether the franchise expanded or contracted on any particular year (the shape of the symbol). The first digit of each number inside the bubbles always indicates the type of class restrictions in place at the time, ranging from 0 (no suffrage), 1 (estate representation) to 7 (no class restrictions at all); the second digit indicates the type of gender restrictions in place, ranging from 0 (no female suffrage at all) to 2 (equal suffrage rights for men and women). Thus "7" means "manhood" suffrage (all adult males can vote, without property qualifications, so long as they are not disqualified by "other restrictions"), and "72" means universal suffrage (all adults can vote, without property qualification). The code "SN/O" means either that the franchise is determined at a subnational level and hence no single set of class and gender restrictions applies throughout the territory (as in the USA for the 19th century), or that there is an at least partly elected assembly but no franchise information is recorded (this is mostly the case for colonial legislative assemblies before independence in African countries).
The maps start out very sparse; only a few countries in the world recognized an electoral norm in any form at the beginning of the 19th century, though I'd wager that a few of the early adopters, even in class restricted form, are not very well known: Haiti in 1804 (before most of Europe), most central American countries by the 1820s, all Latin America by 1830. The first country in the dataset to adopt full "manhood" suffrage is Greece in 1844 (before France in 1848); the Austrian part of the Austro-Hungarian empire apparently had some form of class restricted female suffrage by 1861, though New Zealand of course was the first to achieve true "universal" suffrage. (Which is cool). Japan had a form of class-restricted suffrage by 1889, and Iran had full "manhood" suffrage by 1914, along with most of the Balkan countries, followed shortly by Iraq and Turkey, the latter of which achieves universal suffrage by 1930, before Uruguay, the first Latin American country to get there (in 1932).
The most striking thing the animation shows, to me, is how complete is the shift between the world of the 18th century, where politics was structured around norms of hereditary selection, and today's world, where politics everywhere is structured around electoral norms. We can see this at a glance by just looking at the relative frequency of franchise restrictions:
 |
| Figure 1: Franchise types worldwide, 1788-2008 |
The magnitude of the shift is staggering. The number of countries that do
not recognize a norm of universal suffrage is tiny: less than 6% of all countries. And about half of these have universal male suffrage anyway; the half that makes no concessions to the suffrage norm at all - or for which no information is available in the dataset, but is safe to assume have no suffrage at all - consists of the few remaining absolute monarchies. No big country, save for Saudi Arabia (which is not that big), rejects the principle that rulers should be selected via elections (even North Korea enshrines the principle in its constitution!). Universal suffrage is about as close to a cultural universal today as these things get. (And, incidentally, it was not a particularly European practice even early in the 19th century, as we see in the slideshow above).
To be sure, the fact that a norm is publicly recognized - is enshrined in constitutions and given lip service in other ways - does not mean that it is actually very meaningful. The "legitimacy" of the norm, to use a word
I dislike very much, does not mean that the norm will be followed, or that it will affect power structures to any significant extent. (Incidentally, the same was true of norms of ascriptive selection in the European middle ages, a subject I would like to return to later; for all its symbolic influence, general belief in heredity as a principle of selection did
not mean the norm was generally respected). Universal suffrage does not mean democracy.
It is true enough that the meaning of the norm of universal suffrage varies with the context; the fact that all adults could vote in the Soviet Union or Libya had different political implications than the fact that all adults can vote in New Zealand or Venezuela. But it is still striking that there is now so little political conflict over the principle of universal suffrage, which was once new and terrifyingly radical. That there was at one point a real conflict over the norm - over whether it was the right norm, and who should be allowed to vote - is shown in the frequency of suffrage
contractions in the 19th century. Here we can see the traces of large-scale class conflict being played out precisely over the meaning of the norm of voting. Of the 39 franchise contractions unambiguously recorded in the dataset, the vast majority (71%) happened in the 19th century, most in Latin America, a testimony to the fierceness of conflict over the norm at the time:
 |
| Figure 2: Expansions and contractions of the franchise, 1788-2008, all countries |
(Franchise contractions are the pinkish bars at the bottom).
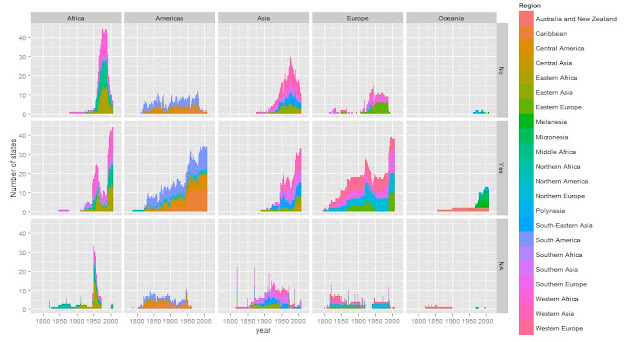
 |
| Figure 3: Franchise changes by region, 1788-2008, all countries |
Franchise contractions were often quickly counterbalanced by franchise expansions, as we can see in the slideshow above; the rich never held the
normative advantage for long (even if they, of course, held the power). Interestingly, it looks that as overt class restrictions on the franchise disappeared, certain other kinds of restrictions became more important, though the dataset seems patchier here, and it does not include every other restriction we can think of (like felon disenfranchisement). Overt class conflict over the meaning of the norm of voting in the 19th century yields to other forms of conflict: anticlerical conflicts, military-civilian conflicts, ethnic conflicts, territorial conflicts, all of which leave their traces in the constitutional changes recorded in the dataset. (Female enfranchisement comes in two waves, one early in the 20th century and another in the 1950s; the second wave at least seems to have involved no significant male-female conflict, but instead resulted from party competition, as Przeworski documents more fully
in this excellent paper). There are even a couple of cases - Kenya in the 1950s and the Soviet Union for a couple of decades after 1918 - where the voting system explicitly disenfranchised the propertied (a real-life antecedent of
the voting system I described theoretically here); the advantage in the conflict over the meaning of the norm had swung so radically to the poor that this was even thinkable, though these experiments didn't seem to have had much of an impact for the later development of the norm. Nevertheless, most of the more noxious "other" restrictions on the franchise have also disappeared today, even if restrictions on military personnel voting still remain in a a couple of places:
 |
| Figure 4: Other restrictions on the franchise, 1788-2008, all countries |
Latin America again stands out as an outlier in the extent to which its political conflicts were waged in the normative terrain of the franchise: who is excluded, and who is included, has been a much more contested issue there than elsewhere. And most Latin American "other restrictions" have been about the place of the military, reflecting a longer history of tensions between civilian and military powers there (code 6 indicates restrictions on voting by military personnel).
 |
| Figure 5: Regional distribution of other restrictions on the franchise, 1788-2008, all countries |
Still, one might think that countries may recognize universal suffrage constitutionally, but fail to hold elections, or fail to hold elections for meaningful offices, or elections that allow for opposition. Yet as the number of countries with suffrage has increased, so have the numbers of at least partly elected legislatures with real powers (the figure refers to lower chambers with genuine legislative competences; mere advisory councils, elected or appointed, as in Saudi Arabia, don't count):
 |
| Figure 6: Composition of legislatures around the world, 1788-2008 |
In fact, only a few countries around the world fail to have today any kind of at least partly elected legislature; and even those "partly appointed" legislatures seem to be mostly elected anyway (I use data for 2000, which is more complete for some reason- but the numbers are not likely to have budged much since then):
 |
| Figure 7: Composition of legislatures around the world, 2000 |
(North Korea has the dubious distinction of holding elections but having no meaningful legislature). And along with elected legislatures, we see a corresponding increase in the frequency of elections worldwide:
 |
| Figure 8: Number of elections in the world per year, 1788-2008, all countries |
In fact, we may be reaching "peak election": there are about 0.35 elections per year per state (counting only national legislative and presidential elections), which is what one would expect from typical electoral cycles of about 3-4 years if
every country in the world held elections:
 |
| Figure 9: Number of elections per year as a proportion of the number of states in the world |
Interestingly, the maximum number of elections relative to the number of states in the state system was in 1920! And as we might have guessed from
the information in this post, "peak authoritarianism" in the 1970s was also the nadir of elections relative to the number of countries in the state system. But even then, there were lots of elections. Elections where opposition was NOT allowed were in fact almost as common then as elections that opposition was able to contest:
 |
| Figure 10: Number of elections per year with and without political opposition |
Both types of election, those with and without opposition, are old; "single party" elections are not the invention of the communist regimes of the 20th century. Yet the open banning of opposition parties - the attempt to stamp out opposition completely - seems to have been more common wherever norms enshrined in constitutions were openly disregarded:
 |
| Figure 11: Presence or absence of opposition according to whether or not a constitution is "in force" |
Though note, again, how during peak authoritarianism in the 1970s we see the highest number of cases where constitutions explicitly banned political pluralism of any kind. Incidentally, these were mostly in Africa and Asia, as well as in the communist states of Europe; in many Latin American dictatorships (e.g., Brazil) opposition was not completely banned, at least not all of the time.
 |
| Figure 12: Regional distribution of states with and without political opposition |
So the switch towards a norm of universal suffrage has been accompanied (disregarding peak authoritarianism in the 1970s) by a switch towards a norm of political competition; in fact the number of states without opposition seems to have averaged about a quarter of the total, regardless of franchise type, and is quickly decreasing.
 |
| Figure 13: Proportion of states with and without political opposition by franchise type |
I am not saying, of course, that states that allow some political opposition are "democratic" in any strong sense. (I am coming to dislike the word). Political competition is restricted in many ways around the world,
some of them quite subtle, and some of them less so. But it is striking that the normative shift over the last two centuries
does seem to have increased the competitiveness of political life, if nothing else, in ways that have
not been reversed over the span of two centuries. One can look, for example, at the number of elections where the incumbent party remains in power after the election, regardless of whether or not they "won" the election (I'm telling you, this dataset is fantastic); and here the trend is inexorably towards greater competition, even if elections are still mostly won by incumbent parties around the world. But whereas elections in the 19th century produced incumbent victories between 80 and 90% of the time (or rather, resulted in opposition parties actually taking power only between 10-20% of the time), elections today result in incumbents leaving office nearly 40% of the time:
 |
| Figure 14: Electoral outcomes per year, 1788-2008, all countries |
So the normative shift is real and reflected in a number of different aspects of political competition. In general (with some exceptions), the longer a history of elections, the lower the degree of incumbent advantage. In this graph, the length of the bar represents the number of elections recorded in the dataset, and the color represents the type of outcome; red indicates an opposition party was able to take power after winning the election (an "alternation" in power, in the language of Przeworski):
 |
| Figure 15: Electoral outcomes per country |
(The black lines identify the USA, New Zealand, and Venezuela, the three countries that have been "home" to me, all of them countries with long histories of elections, and from where most of the readers of this blog come). Another way of viewing this information is by plotting the percentage of times the incumbent has won an election per country:
 |
| Figure 16: Proportion of elections where incumbent party remained in power per country |
The USA stands out as a country where incumbent advantages have historically been low - more so than many other places with long histories of democracy; only the Netherlands and the UK, among countries with comparably long histories of elections, have had lower degrees of incumbent advantage. And the regional patterns are perhaps as one would expect. Think of the "green" in the following map as places where it has historically been safe to be an incumbent in an election:
 |
| Figure 17: Political competitiveness in elections worldwide, 1788-2008 |
Incumbent advantage has historically been lowest in the richest parts of the world, though there are some obvious outliers, and the correlation does not indicate any form of causation, even if theory does lead us to expect that the degree of incumbent advantage would be negatively correlated with long-run growth (a test I have not performed, but may later).
Finally, it is worth noting that most people seem to have become
more, rather than
less, enthusiastic about participating in elections since the 19th century. As the number of people capable of participating and actually participating in elections has increased with changes in the franchise...
 |
Figure 18: Ratio of the number voters in legislative elections to total population
(Each dot represents the ratio of voters to the total population in a particular election in a given country; some very low ratios are due to boycotts).
|
 |
| Figure 19: Ratio of participating voters to total population, by franchise types |
The proportion of eligible voters participating has increased, not decreased:
 |
| Figure 20: Voter turnout per year, 1788-2008, all countries, in elections with and without opposition |
(Each dot represents an election in a given country; turnout is calculated as the ratio of participating voters to the proportion of actually eligible voters).
 |
| Figure 21: Voter turnout in legislative elections, 1788-2008, with and without opposition |
Turnout nevertheless has varied quite a bit by country:
 |
| Figure 22: Voter turnout in legislative elections per country, all years |
(Turnouts greater than 100% represent either problems with reported numbers of participating voters, or the fact that more people voted in some elections than were actually eligible according to franchise rules. Interestingly, the USA has always had lower turnout rates than a lot of other countries; and high turnouts do not appear to have ensured good governance. It is also worth noting that the highest turnouts have all been in elections without opposition, where voting is a form of signalling, and is encouraged by coercive mobilization, even if it makes no difference to the outcome).
In sum, we seem to live in a golden age of participation, even as elections are often thought to be disappointing, and voting irrational. Elections are the great ritual of the age, though they certainly don't make as much difference as most people seem to think. The aggregate effect of all this electoral activity seems to be mostly, if marginally, positive; yet elections have not reduced injustice or inequality as much as early proponents of universal suffrage had hoped.
It is nevertheless striking that conflicts that were once fought on the terrain of the norms concerning suffrage and elections have shifted to other terrains; the norm is no longer the object of live struggle. And if elections and universal suffrage did not make as much material difference as its proponents had historically hoped, they nevertheless seem to have ultimately accomplished a great "redistribution of status." It is no longer possible to signal unequal status by depriving people of the vote. We seem to have all become democrats at least in the sense that most people everywhere all publicly recognize the norm that all adults are equal citizens who all should have one vote, even if that norm is routinely violated or made meaningless still in many parts of the world.
Data and methods note
First, a thank you to Adam Przeworski for making available the
PIPE dataset here. Like most very large-scale historical datasets of political data, the PIPE dataset misses some things, given the patchiness of the historical record (the dataset only aims at full completeness from 1917 onwards, though it does try to go back to the inception of representative institutions in every country still existing today), and some starting dates are a bit arbitrary (for example, the United Kingdom only enters the dataset in 1800, and has franchise information starting only in 1832, with the first Reform Act). Judgments about institutions are sometimes difficult to make. But in general, this is great data.
I nevertheless had to clean it up a bit to create the maps and graphs in this post. I first cleaned up the country names and fixed a few other minor things using Google Refine, added capital cities and their latitude and longitude (mostly using
the cshapes R package by Nils Weidmann), added franchise data for Russia (which was missing), and then calculated a number of variables. The record of all this data wrangling is available in
this repository, in the file Processing PIPE.R (and the Google Refine JSON extract). The code for the graphs is available in the file Final graphs.R. The code might change as I clean it up; right now it is essentially one big hack.
[Update, 12 September: Fixed some typos and minor stylistic problems]
[Update, 16 September: Code for processing PIPE now greatly simplified - see repository]


No comments:
Post a Comment